
Figure 2.
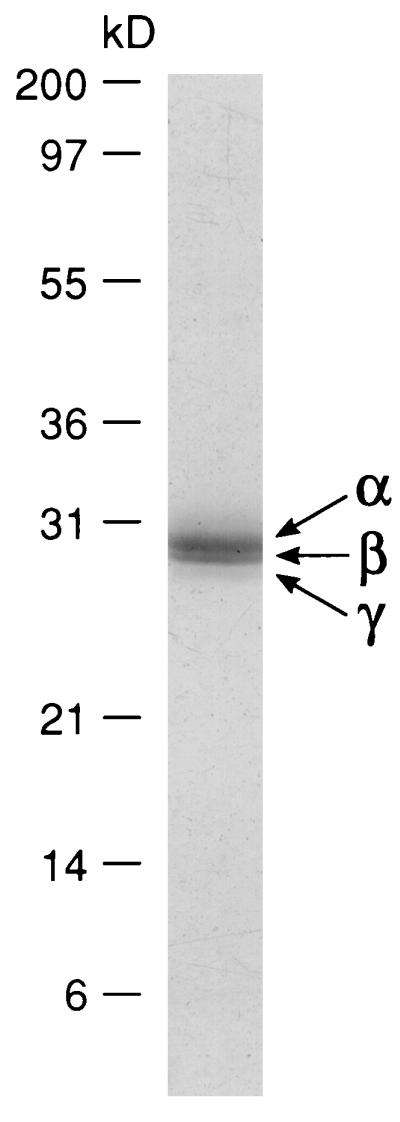
Electrophoretic profile of proteins from axial filaments. Filaments (10 μg of protein) were subjected to SDS/PAGE on a 4–20% gradient polyacrylamide gel followed by staining with Coomassie brilliant blue R250. Silicatein α, β, and γ are indicated by arrows. Numbers indicate molecular masses of standard proteins.