
Figure 1.
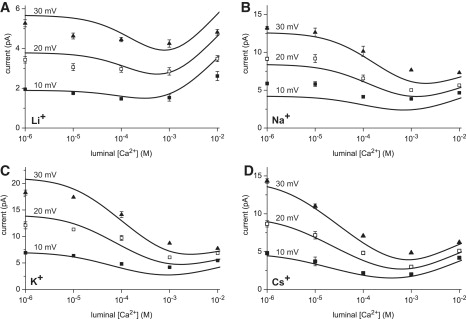
Comparing the AMFE predictions of the model (lines) to experiments (symbols). Ca2+ is added to the luminal bath while both baths contain 100 mM X+ for different monovalents X+: (A) Li+, (B) Na+, (C) K+, and (D) Cs+. The currents at 10, 20, and 30 mV are shown. Experimental error bars smaller than the symbol are not shown. The 20 mV curves in panels B and D were published previously (21).