
Figure 2.
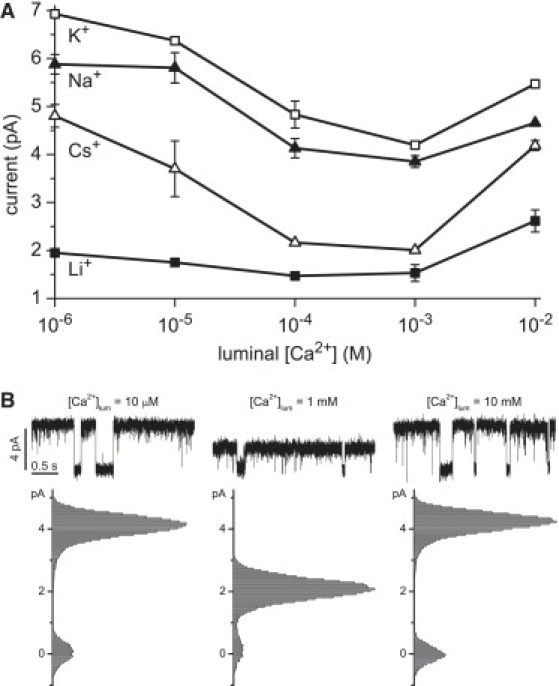
(A) The experimental data for Li+, Na+, K+, and Cs+ at 10 mV from Fig. 1. (B) Representative current recordings and histograms at 10 mV for 100 mM Cs+ and the indicated concentration of luminal Ca2+.
Official websites use .gov
A
.gov website belongs to an official
government organization in the United States.
Secure .gov websites use HTTPS
A lock (
) or https:// means you've safely
connected to the .gov website. Share sensitive
information only on official, secure websites.
(A) The experimental data for Li+, Na+, K+, and Cs+ at 10 mV from Fig. 1. (B) Representative current recordings and histograms at 10 mV for 100 mM Cs+ and the indicated concentration of luminal Ca2+.