
Figure 3.
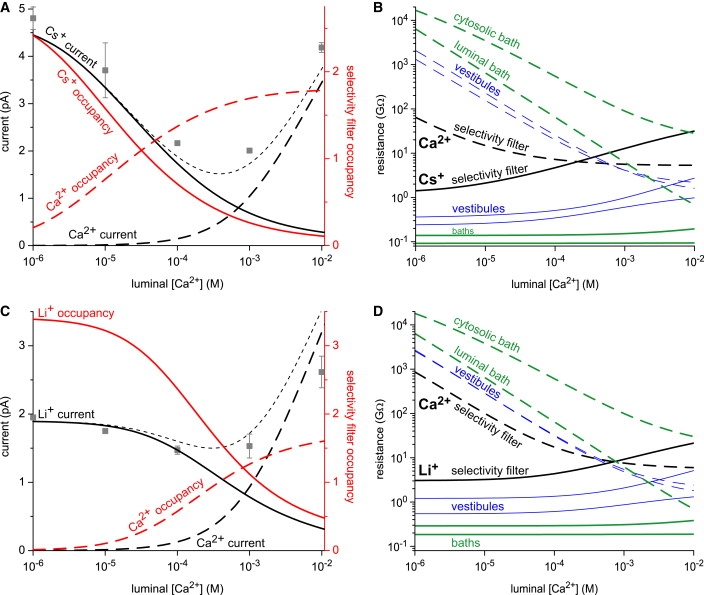
(A) Ca2+ and Cs+ current (black lines, left axis) and number of Ca2+ and Cs+ in the selectivity filter (red lines, right axis) as [Ca2+]lum is increased. The net current is shown with the dotted line and the experimental results are shown with gray squares. (B) The resistances of Cs+ (solid lines) and Ca2+ (dashed lines) in the selectivity filter (black lines), the cytosolic and luminal vestibules (blue lines), and the baths (green lines). (C and D) Same as panels A and B with Li+ substituted for Cs+. The applied voltage is 10 mV.