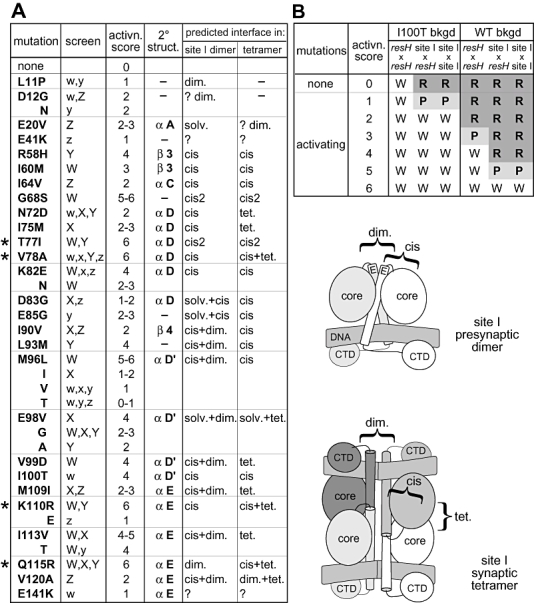
Fig. 2.

Activating mutations in Sin. A. The activating mutations listed were selected from libraries of random mutants generated in three different backgrounds (see text for details): WT (screen W), I100T (screen X) and R54E/I100T (screens Y and Z). Many mutations were selected in more than one background, as indicated: upper case (W, X, Y, Z) denotes mutations selected without secondary mutations; lower case (w, x, y, z) denotes mutations selected along with secondary mutations, but shown to confer a phenotype after separation. The ‘activation score’ is a measure of how strongly a mutation activates recombination (see B). The location of each mutation in the secondary structure of Sin bound at site II (Mouw et al., 2008) is given. Structural interfaces on which mutated residues are predicted to reside in the inactive site I dimer, and in the active site I synaptic tetramer, are also listed (‘predicted interface in site I dimer/tetramer’). Interfaces are defined in the accompanying cartoons, which subdivide each subunit into the ‘core’ catalytic domains (containing helices A, B, C, D and D′) the E helix, and the CTD: dim., interfaces between two subunits in the same dimer; cis, interfaces between helix E and the core domain of the same subunit, or between helix D′ and the remainder of the core domain of the same subunit; cis2, interfaces between helix C and helix D within the core domain; tet., the synapsis interface between the two dimers in the tetramer; ‘?’ denotes residues that are disordered in the Sin structure (residue E41) or whose structural role is unclear. The assignments are based on the Sin site II-dimer structure (Fig. 8A; Mouw et al., 2008), on the γδ resolvase site I synaptic tetramer structure (Li et al., 2005), and on a Sin site I synaptic tetramer generated by homology modelling (Figs 1C and 8C). B. The ‘activation score’ of a mutation is a convenient numerical measure of the extent to which the mutation activates recombination. Each score represents a specific set of in vivo phenotypes conferred by the mutation in WT and I100T Sin backgrounds, in assays with resH ×resH, resH × site I and site I × site I substrates. W (white colonies) indicates complete resolution; P (pink colonies) indicates partial resolution; R (red colonies) indicates no (or very slow) resolution. The WT and I100T Sin backgrounds provide different ‘windows’ of sensitivity. For example, weak activating mutations such as N72D affect the phenotype in the I100T background, but not in the WT background. The maximum score of ‘6’[given to four mutations, indicated by asterisk (*) in (A)] indicates complete resolution of all three substrates in the WT background.
