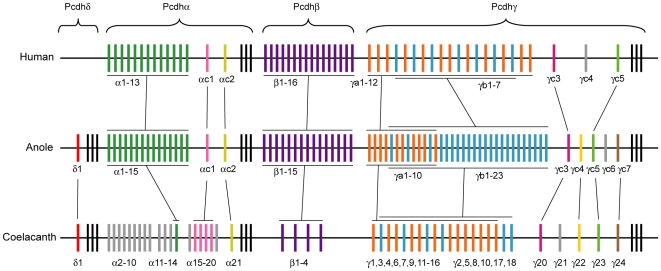
Figure 4. Evolutionary relationships of protocadherin clusters in coelacanth, the green anole lizard and human.
Variable exons are shown as colored or grey vertical bars. The constant exons are shown as black vertical bars. Paralogs in the same subgroup or orthologs between the species are shown in the same color.

