
FIG. 6.
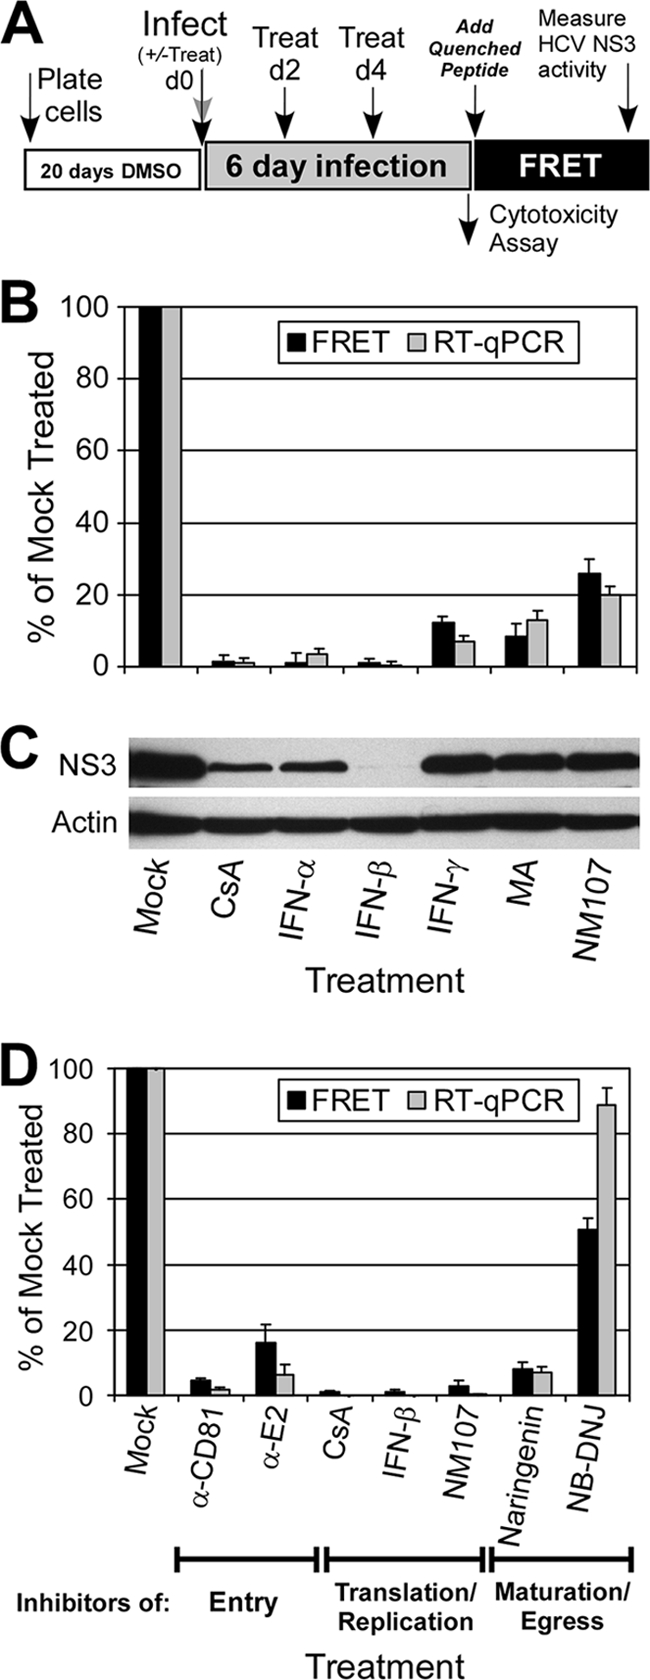
Quantitative identification of inhibitors that act throughout the HCV life cycle. (A) HTS experimental design. (B) DMSO-Huh7 cells were infected with HCVcc at 0.05 FFU/cell and treated with 2.5 μM CsA, 100 U/ml IFN-α, 100 U/ml IFN-β, 100 U/ml IFN-γ, 10 μM MA, or 18.5 μM NM107. Compounds were added at 2 days p.i. and were replenished in fresh medium at day 4 p.i. At day 6 p.i., triplicate cultures were assayed for HCV RNA levels by RTqPCR and for NS3 protein levels by FRET. Data are presented as a percentage of mock-treated cells. (C) HCV NS3 and cellular actin protein levels in parallel cultures were determined by WB analysis. (D) DMSO-Huh7 cells were infected with HCVcc at 0.05 FFU/cell and treated with HCV inhibitors that act at different stages of HCV infection: 50 μg/ml α-CD81, 100 μg/ml α-E2, 2.5 μM CsA, 250 U/ml IFN-β, 18.5 μM NM107, 200 μM naringenin, and 500 μM NB-DNJ. Compounds were added at the time of infection and were replenished every 2 days over the 6-day assay. At day 6 p.i., triplicate cultures were assayed for HCV RNA levels by RTqPCR and for NS3 protein levels by FRET. Data are presented as a percentage of mock-treated cells.