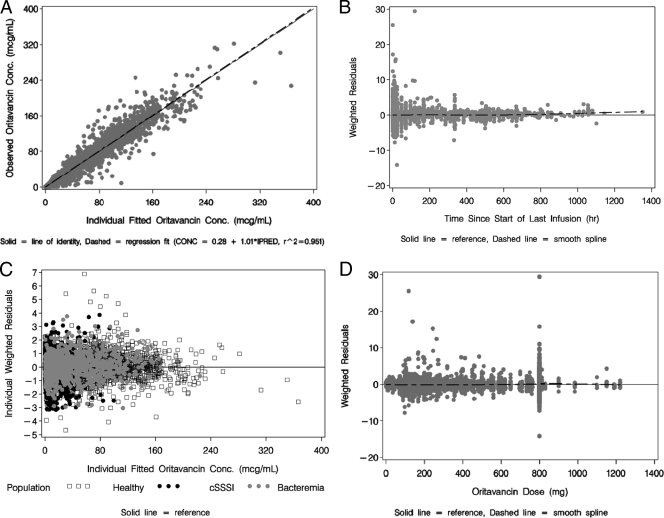
FIG. 2.
(A) Scatterplot of observed versus individual fitted oritavancin concentrations for the final population PK model. (B) Scatterplot of population weighted residuals versus time since the start of the last infusion for the final population PK model. (C) Scatterplot of individual weighted residuals versus individual fitted oritavancin concentrations for the final population PK model, stratified by population. (D) Scatterplot of the population weighted residuals versus dose for the final population PK model.

