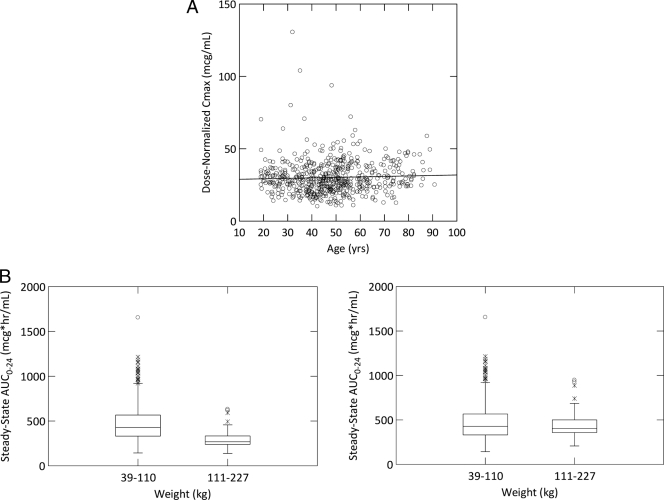
FIG. 3.
(A) Scatterplot of dose-normalized Cmax versus age (line represents a linear regression fit of the data). (B) Boxplots of predicted, steady-state AUC0-24 values versus weight categories for two different dosing regimens. The left panel presents the predicted AUC0-24 when subjects are given 200 mg daily, regardless of body weight. The right panel presents predicted AUC0-24 when subjects are given 200 mg daily when body weight is less than or equal to 110 kg and 300 mg daily when body weight is greater than 110 kg.

