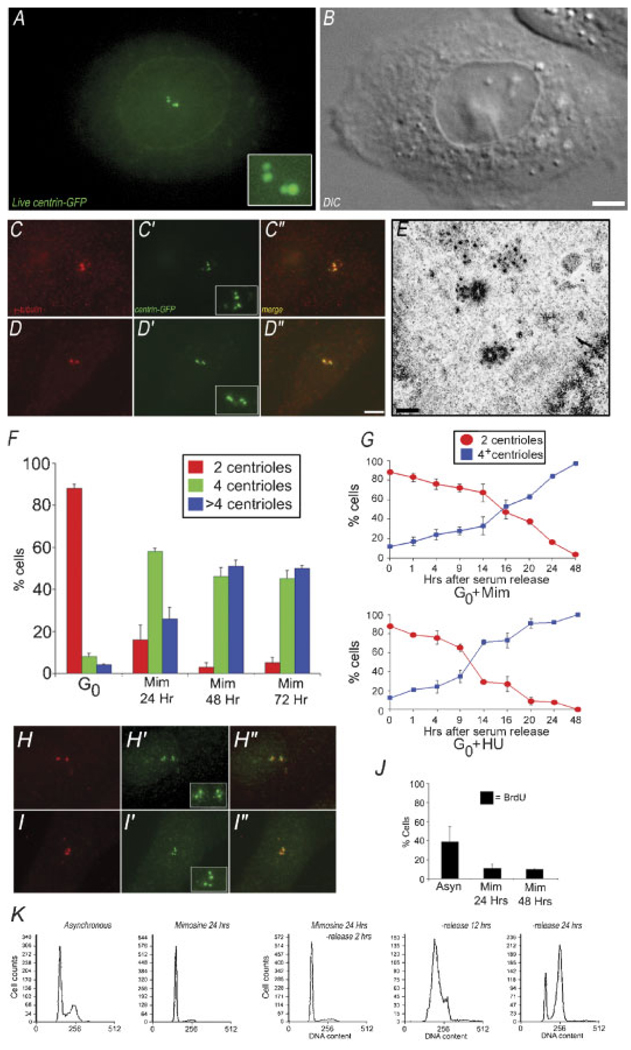
Fig. 2.
G1 arrested CHO cells support centrosome duplication. A: Maximum intensity projection of centrin-GFP fluorescence in a live CHO-A8 cell, released from G0 in the presence of 600 mM mimosine for 20 h. There are two pairs of bright fluorescent dots, as well as centrin-GFP fluorescence in the nuclear region. B: Corresponding DIC image of cell in (A). C,D: Immunofluorescent images of CHO-A8 cells arrested in G1 for 24 h. Cells are labeled with anti-γ tubulin/centrin 2-GFP, showing two pairs of centrin-GFP fluorescent dots, co-incident with anti-γ tubulin foci. E: Transmission electron micrograph of a CHO-A8 cell released from G0 into mimosine for 20 h prior to fixation and embeddment. Each of the parental centrioles is assembling a short pro-centriole at right angles. F: Centriole number in a population of G0 cells, and G1 cells (24, 48, and 72 h after serum release into mimosine). Graph shows percentage of cells containing either 2, 4, or >4 centrioles per cell. Data are average of three experiments, 200 cells per condition. G: Centriole number in cells treated with mimosine or HU fixed at intervals following serum release from G0. Note that the number of cells with four centrioles begins to increase between 14 and 16 h for mimosine, and 9 h for HU. Average of three experiments, 200 cells per time point. H–H″/I–I″: Immunofluorescence images of two separate CHO-K1 cells, released from G0 into mimosine for 20 h, then fixed and labeled with anti-γ tubulin (H,I), and anti-centrin 2 (H′,I′).H″, I″: Merged images, showing co-localization of centrin pairs and γ-tubulin positive centrosomes. Each cell contains a pair of anti-centrin 2 positive foci coincident with the two γ-tubulin positive foci. J: BrdU incorporation in control versus cell cycle arrested cells. Graph shows % of cell positive for anti-BrdU fluorescence. Mimosine arrests cells prior to the onset of S-phase. K: Flow cytometry of control, and mimosine treated CHO-A8 cells. DNA content of mimosine-treated cells following drug wash-out as they progress into S-phase over 24 h. Bar in (B) = 10 µm, in (D) = 10 µm, and in (E) = 0.5 µm. [Color figure can be viewed in the online issue, which is available at www.interscience.wiley.com.]

