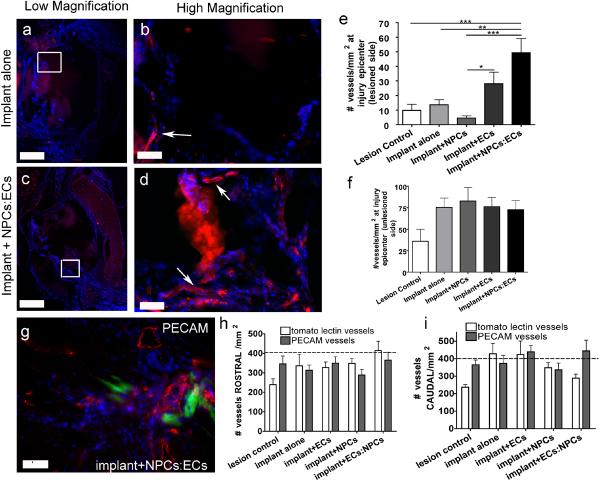
Figure 3. Functional vessels at the lesion epicenter.
All images are spinal cord cross sections in which vessels perfused with biotinylated lectin are labeled with streptavidin-Texas Red and nuclei are labeled blue with DAPI. (a) Low magnification image from the implant alone group. The white box in (a) denotes the region viewed in (b). (b) High magnification image of white box in (a) showing labeled vessels (white arrows). (c) Low magnification image from an implant plus NPCs:ECs group. The white box denotes the region viewed in (d). (d) High magnification of white box in (c) showing vessels which are further marked with white arrows. Scale bars in (a) and (c) are 400 µm. Scale bars in (b) and (d) are 50 μm. (e) Number of vessels/mm2 on the lesioned at the injury epicenter. (f) The number of vessels/mm2 on the unlesioned side at the injury epicenter. (g) PECAM-1 staining of am implant plus NPCs:ECs section on the lesioned side of the injury epicenter. The green cells are NPCs. Scale bar = 50 μm (h) Quantification of tomato lectin and PECAM vessels 3.6 mm rostral to the injury epicenter and (i) 3.6 mm caudal to the injury epicenter. The dotted line denotes the approximate number of vessels found in the grey matter of a normal spinal cord. Error bars = ± SEM. * = p<0.05, ** = p<0.01, *** = p<0.001.

