Fig. 1.
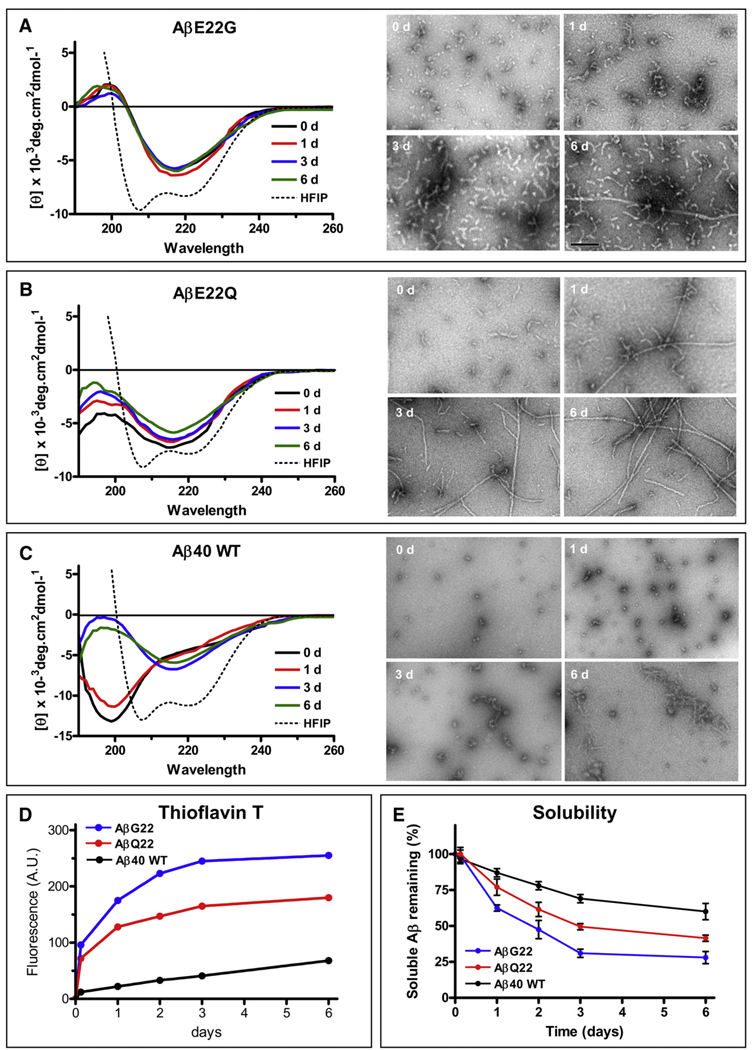
Fibrillization and structural studies of Aβ40 and mutants E22Q and E22G. (A) Changes in secondary structure of the Aβ E22G variant during the 6 days duration of the aggregation experiments in saline solution (left panels). The broken line indicates the α-helical structure of the peptide when solubilized in HFIP. Right panels illustrate EM images of the same samples at different time points (0, 1, 3 and 6 days). (B) Changes in secondary structure of the Aβ E22Q variant during the 6 days duration of the experiments (left panels); the broken line also indicates the α-helical structure of the peptide when solubilized in HFIP [note the similarities with (A)]. The right panels show electron microscopical images of the same samples at 0,1, 3 and 6 days. (C) Changes in secondary structure of Aβ40 wild type during the 6 days duration of the experiments in PBS (left panels). The broken line indicates the α-helical structure of the peptide when solubilized in HFIP [note the similarities with (A) and (B)]. The right panels show electron microscopical images of the same samples at 0, 1, 3 and 6 days. (D) Fluorescence values of Thioflavin T binding assay for samples collected at the different time points during the 6-day duration of the experiments. The data is representative of three independent experiments. (E) Peptide solubility at each time point estimated by O.D. 280 nm following 1 h centrifugation at 14,000× g as described in Materials and methods. Results are expressed in percentage of the peptide remaining in solution; mean ± SD of triplicate experiments.

