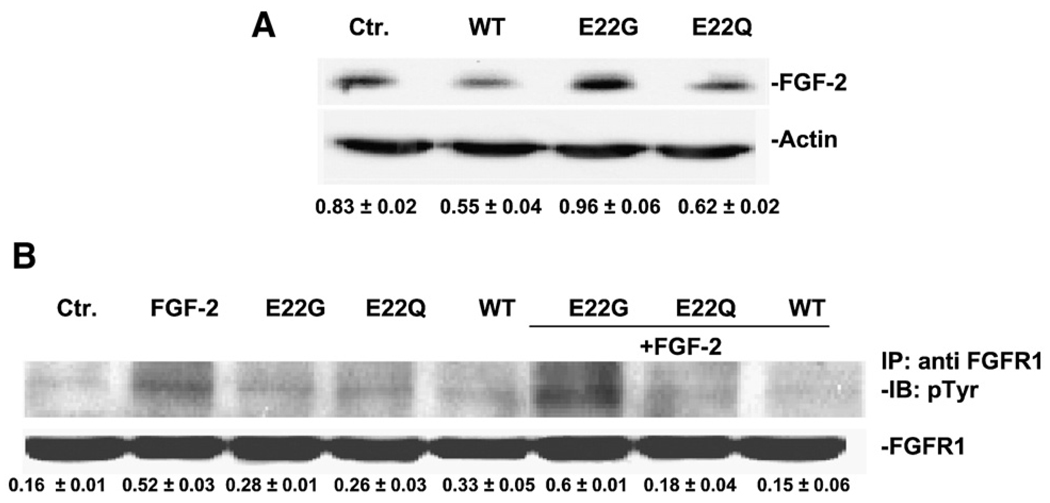
Fig. 4.
FGF-2 expression and FGFR-1 phosphorylation response to Aβ peptides. (A) The effect of WT, E22Q and E22G on FGF-2 production was assessed by Western blotting. A representative gel out of three with similar results is shown. Normalization of optical densities (OD, FGF-2/Actin) is indicated below each lane. ANOVA test showed significant difference between control and treated group. P < 0.01 for WT or E22Q vs. Ctr. (B) FGFR-1 phosphorylation in cells pre-treated with Aβs (5 µM), in response to FGF-2 (20 ng/ml, 15 min). FGFR-1 was immunoprecipitated (IP), its activation was investigated by anti-Tyr antibody and the results were normalized with total FGFR-1. The gel shown is representative of three experiments exhibiting similar results. P < 0.01 for FGF-2+WT or FGF-2+E22Q vs. FGF-2.

