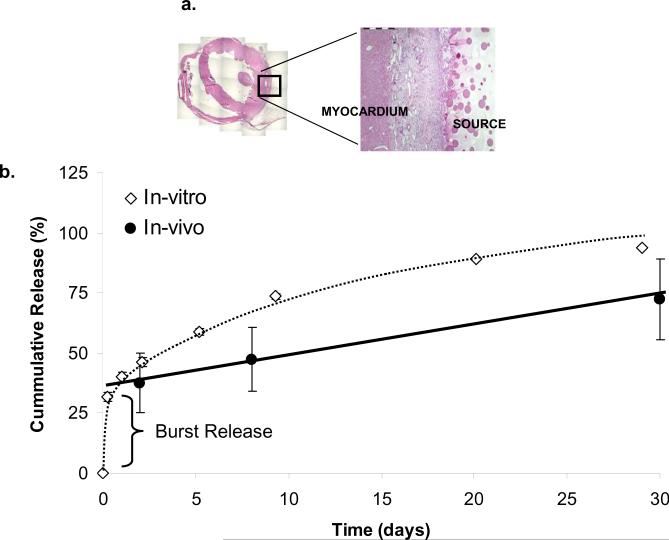
FIGURE 4. Polymeric Devices Sustain Release FGF1 over 30 days.
(a) Cross sectional area of H&E stained rabbit myocardial tissue shows location of drug release source (adjacent to left ventricular free wall) and interface between drug source and myocardium. (b) Percentage of cumulative 35S-FGF1 released into PBS buffer in-vitro (white diamonds, data represent mean ± s.e.m. (n=10), 100% corresponds to approximately 90μg 35S-FGF1 per circular disk of 8mm diameter and 1mm thickness), and throughout in-vivo experiment (black circles, data represent mean ± s.e.m. (n=3), 100% corresponds to approximately 450 μg 35S-FGF1 per device (20mm × 20mm × 1mm) for in-vivo experiments), calculated by % drug released = (total drug within source – total drug remaining)/ total drug within source × 100 %.

