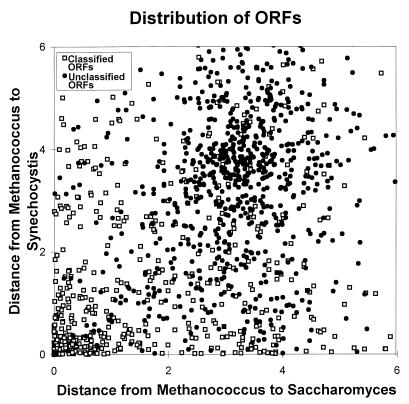
Figure 1.
The distribution of ORFs indicates that classified ORFs are distributed differently than unclassified ORFs. This scatterplot displays the distance between a methanogen gene and its cyanobacterial ortholog on the vertical axis and the distance between the methanogen gene and its yeast ortholog on the horizontal axis. Orthologs of classified ORFs (□) are closely related (corresponding to small distances) and therefore are distributed about the origin at the lower left. In contrast, orthologs of unclassified ORFs (•) are distantly related and are distributed about (3.5, 3.8). Distance estimates between orthologous genes were obtained from blastp (17) probabilities (see Methods).

