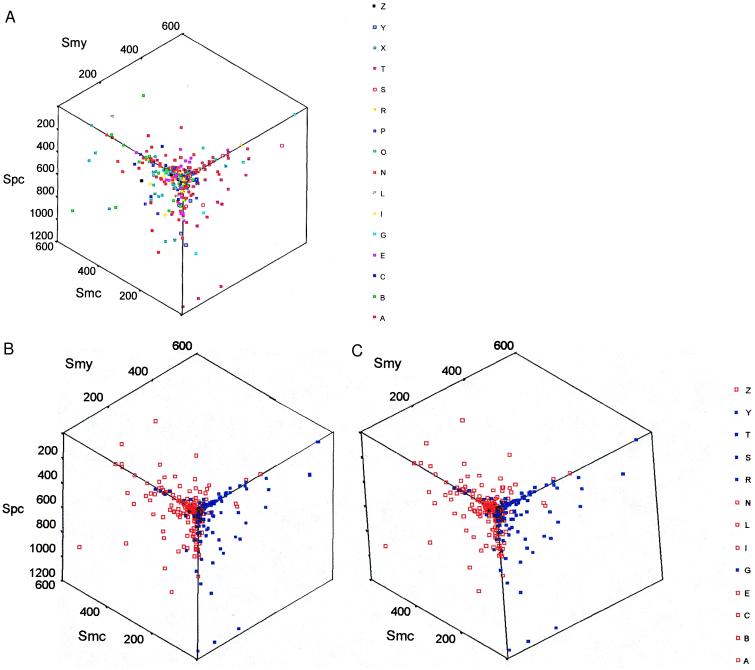
Figure 2.
A three-dimensional display of gene orthologs classified by function or by lineage. (A) The sets of gene orthologs are labeled by their functional classes. In the stereo view (B), the classes are combined into two superclasses corresponding to whether the genes function in informational (blue) or operational (red) processes. The axes are similarity scores between the methanogen and cyanobacterial orthologs, Smc, between the methanogen and yeast orthologs, Smy, and between the proteobacterial and the cyanobacterial orthologs, Spc. The functional categories are: amino acid synthesis (A), biosynthesis of cofactors (B), cell envelope proteins (C), energy metabolism (E), GTPases and homologs of vacuolar ATPases (G), intermediary metabolism (I), fatty acid and phospholipid biosynthesis (L), nucleotide biosynthesis (N), other (O), cell processes (P), replication (R), transcription (S), translation (T), transport (X), tRNA synthetases (Y), and regulatory genes (Z). The divisions into functional categories are good, but exceptions exist such as valyl-tRNA synthetase, which appears in the operational group.

