
Fig. 2.
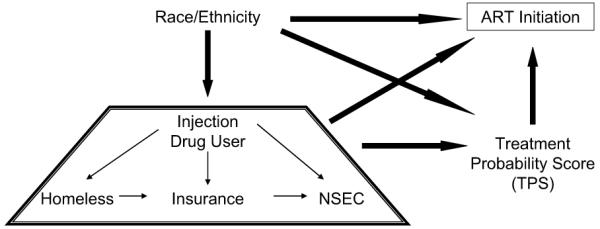
Schematic representation of initial (saturated) treatment initiation path model tested. Each item in the trapezoid is hypothesized to be independently affected by race/ethnicity and to independently affect TPS and ART initiation.
Official websites use .gov
A
.gov website belongs to an official
government organization in the United States.
Secure .gov websites use HTTPS
A lock (
) or https:// means you've safely
connected to the .gov website. Share sensitive
information only on official, secure websites.
Schematic representation of initial (saturated) treatment initiation path model tested. Each item in the trapezoid is hypothesized to be independently affected by race/ethnicity and to independently affect TPS and ART initiation.