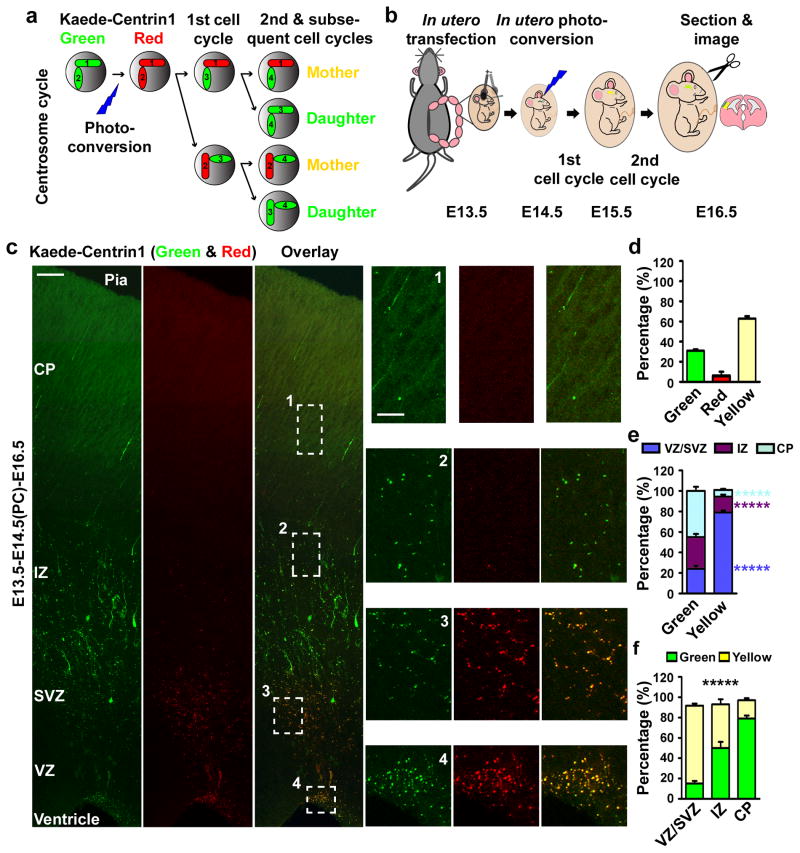
Figure 2. Asymmetric segregation of centrosomes with differently aged mother centrioles.
(a, b) Strategy and experimental procedure for using Kaede-Centrin1 to distinguish between centrosomes with differently aged mother centrioles. (c) Images of E16.5 cortices electroporated with Kaede-Centrin1 at E13.5 and photo-converted (PC) at E14.5 (E13.5-E14.5(PC)-E16.5). Scale bars: 50 μm and 15 μm. (d–f) Quantifications of the percentage of labelled centrosomes that are green, red, or yellow fluorescent (d), the percentage of green or yellow fluorescent centrosomes that are located in different regions of the developing neocortex (e), and the percentage of labelled centrosomes located in different regions of the developing neocortex that are green or yellow fluorescent (f) (total 4,314 centrosomes from seven individual animals). Data are shown as mean±s.e.m.; *****, p<5e-5.

