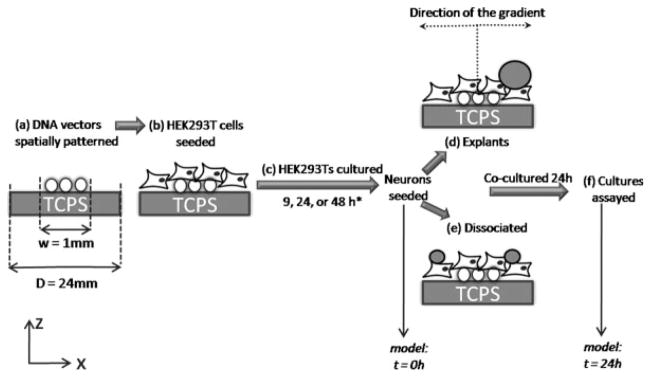
Fig. 3.
Schematic of the coculture system. A schematic outlining the steps involved in coculturing DRG neurons on spatially patterned gene expression. DNA vectors encoding NGF were deposited to specific regions of a tissue culture polystyrene (TCPS) surface (a). HEK293T cells were seeded onto the tissue culture surface with immobilized DNA vectors (b) and cultured for a range of times (9, 24, and 48 hr) (c). *For surface-associated NGF cultures, HEK293T cells were fixed at the end of the culture period to halt NGF secretion. DRG neurons were seeded on top of the HEK293T cultures as entire explants (d) or dissociated neurons (e) (marking the t = 0 hr time point for the mathematical model) and cultured for 24 hr. At the end of the culture period (marking the t = 24 hr time point for the mathematical model), the cocultures were fixed and assayed for neuronal response (f). It is important to note that the schematic only represents the x- and z-planes, but the actual cultures involve a y-dimension, in which the length of the pattern of expression is y = 10 mm. Schematic is not drawn to scale.

