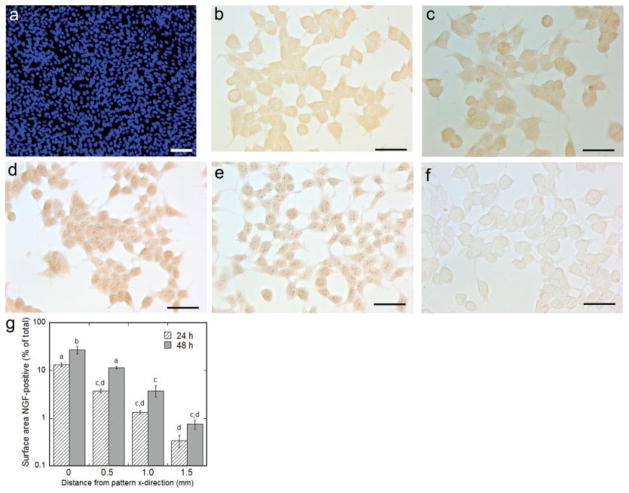
Fig. 6.
Immunocytochemistry for the detection of surface-associated NGF. The accessory cell culture was confluent before ICC (a). The accessory cell culture surface stains positive for NGF at the site of patterned gene delivery for 24 and 48 hr culture, respectively (b,d), and 0.5 mm from the center of the pattern for 24 and 48 hr culture, respectively (c,e), compared with negative control (no pNGF delivery) (f). Quantification of immunostain intensity vs. distance from the pattern center, plotted on a log scale (g). Values are reported as mean ± SEM. *Statistically significantly different at P < 0.05. Scale bars = 100 μm in a; 50 μm in b–e. [Color figure can be viewed in the online issue, which is available at www.interscience.wiley.com.]

