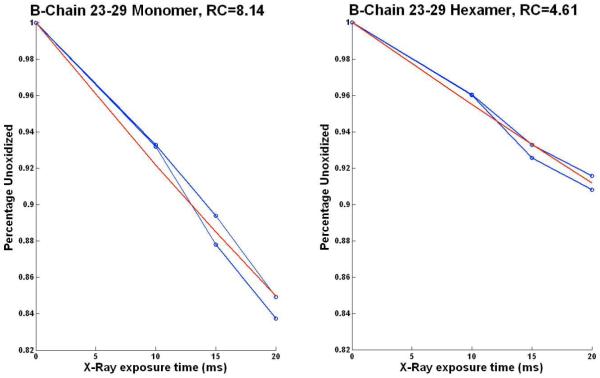
Figure 2.
Dose Response plots for human insulin B-Chain peptide 23-29. The experimental curves (blue) from two sets of experiments fit to the first order theoretical curves (red) corresponding to a rate constant of 8.14 for monomeric form versus 4.61 for the hexamer. Lower rate constant for the hexamer indicates the reduced solvent accessibility for the peptide.

