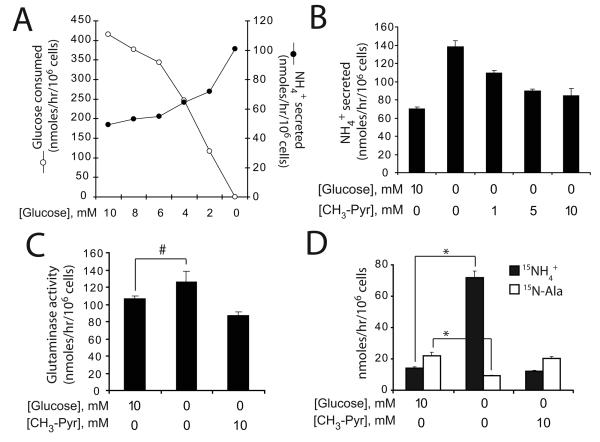
Figure 3. Glucose withdrawal activates glutamate dehydrogenase.
A, Cells were cultured in decreasing glucose concentrations, and the rates of glucose consumption and ammonia production were measured. B, Total ammoniagenesis was measured in cells cultured with or without glucose, and with increasing concentrations of methyl-pyruvate (CH3-Pyr). The average and SD of three independent cultures are shown. C, Glutaminase activity was measured by following transfer of 15N from L-[γ-15N]-glutamine to 15NH4+ in the presence or absence of glucose and CH3-Pyr. The average and SD of three independent cultures are shown. #: p<0.05. D, Cells were cultured in L-[α-15N]-glutamine and the accumulation of 15NH4+ (GDH activity) and of 15N-alanine (ALT activity) was measured in the presence or absence of glucose and CH3-Pyr. The average and SD of three independent cultures are shown. *: p<0.0005

