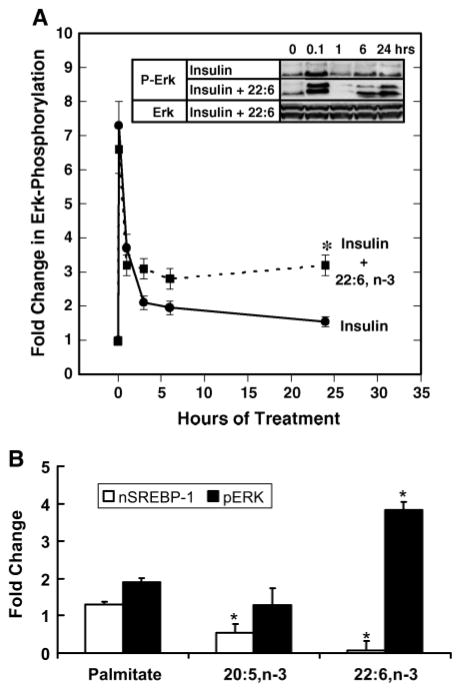
Fig. 6.
Role of Erk in regulating nSREBP-1. A: Primary rat hepatocytes were maintained overnight in Williams E medium containing 20 mM lactate and 10 nM DEX with no serum or insulin. Cells were switched to medium supplemented with either 10 nM insulin (solid line) or insulin + 22:6,n-3 (dotted line). Cells were harvested at the times indicated for measurement of Erk phosphorylation by immunoblotting. The inset shows representative immunoblots of the effects of insulin and 22:6,n-3 on total Erk (Erk) and Erk phosphorylation (P-Erk). Results are normalized to the level of Erk phosphorylation in untreated primary hepatocytes and are shown as fold change in Erk phosphorylation (mean ± SD; n = 4). Results were evaluated by Student’s t-test. * P < 0.01, insulin + 22:6,n-3-versus insulin-treated cells. B: Effect of palmitate, 20:5,n-3, and 22:6,n-3 on nSREBP-1 (white bars) and Erk phosphorylation (black bars). Rat primary hepatocytes were maintained overnight in Williams E medium containing 20 mM lactate and 10 nM DEX with no insulin or serum. Cells were switched to medium supplemented with 25 mM glucose, 10 nM insulin, and 20 μM BSA in the absence or presence of fatty acids at 100 μM plus BSA (20 μM). Cells were harvested 24 h later for nSREBP-1 and Erk phosphorylation (pERK) by immunoblotting. Total Erk protein was unaffected by these treatments (not shown). Results are normalized to the level of nSREBP-1 or Erk phosphorylation in untreated cells (mean ± SD; n = 4). Results were evaluated by Student’s t-test. * P < 0.01, vehicle- versus fatty acid-treated cells.

