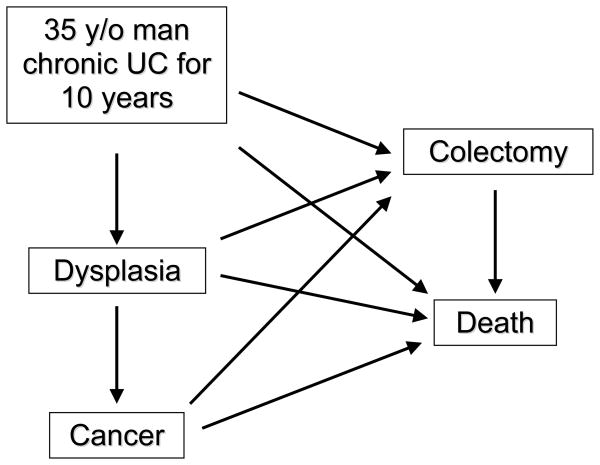
Figure 1. Simplified Schematic of Markov Model Health States and Transitions.
In any given one-year cycle, hypothetical patients start in one of the five health states (rectangles), and have specified rates of transitioning (arrows) to other health states. Each strategy has associated costs and an associated quality of life, measured by utility. Some of the transitions also have costs and effects on utility.

