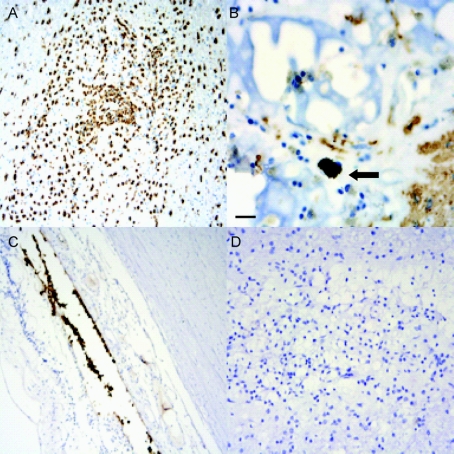
Figure 3 Representative immunostaining results
(A) CD68 immunostain of tract lesion demonstrating inflammatory cell infiltration. (B) Glial fibrillary acidic protein immunostain shows rare immunoreactive astrocytes encroaching on matrix, with retinal pigment epithelial (RPE) cell within matrix lattice (arrow). (C) RPE 65 immunostain of normal human retina highlights RPE cells. (D) RPE 65 immunostain of matrix-containing tract site showing absence of immunoreactivity. Scale bar: 20 μm.

