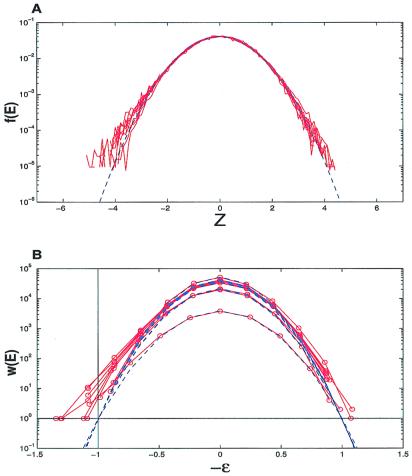
Figure 1.
(A) Normalized distribution of energies f(E) = w(E)/M for decoys obtained by gapless threading (red lines). Ten red lines correspond to the distributions obtained for 10 different proteins (153 l, 1aa0, 1aa8, 1aac, 1aaf, 1aay, 1ab3, 1ab8, 1ab9, and 1aba), each threaded against the full database. Blue broken line shows standard normal distribution. Notice deviation from normal distribution at the low energy tail. (B) Same data shown not normalized [w(E)] as a function of −ɛ (red lines). Notice that Gaussian approximations (blue lines) all cross w(E) = 1 at −ɛ = −1, where the actual number of decoys at this point (red lines) is of the order of 10.

