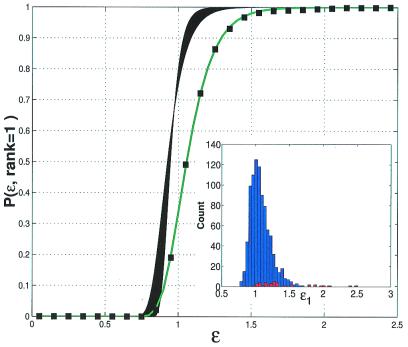
Figure 4.
Probability P(e > ɛ, rank = 1) of having Rank = 1 for a structure with normalized energy above ɛ. Black lines correspond to the probability expected for a Gaussian distribution (Eqs. 8, 12, and 11). Because the number of decoys M is different for different proteins, each of 1,011 proteins has its own line (i.e., different u and α). Black squares show the same probability as obtained from gapless threading. (P(e > ɛ, rank = 1) = 1 − Pdecoy(e > ɛ), where Pdecoy(e > ɛ) = ∫ fdecoy(e) de was obtained by threading). The green line is the best fit of the observed probability by Eq. 9. The best fit is achieved at ufit = 1.01,αfit = 8.03. Corresponding values for a Gaussian distribution are uG = 0.92 and αG = 18.8 (see text for details). (Inset) Distribution of energies of the lowest-energy decoys fdecoy(ɛ). Notice the typical EVD shape of the distribution. Red and blue histograms correspond to the lowest-energy decoys that are native like (Q ≥ 0.7) and nonnative (Q < 0.7), accordingly. Histogram of native-like decoys stretches till ɛ ≈ 2.5, whereas nonnative decoys are not observed above ɛ = 1.8.

