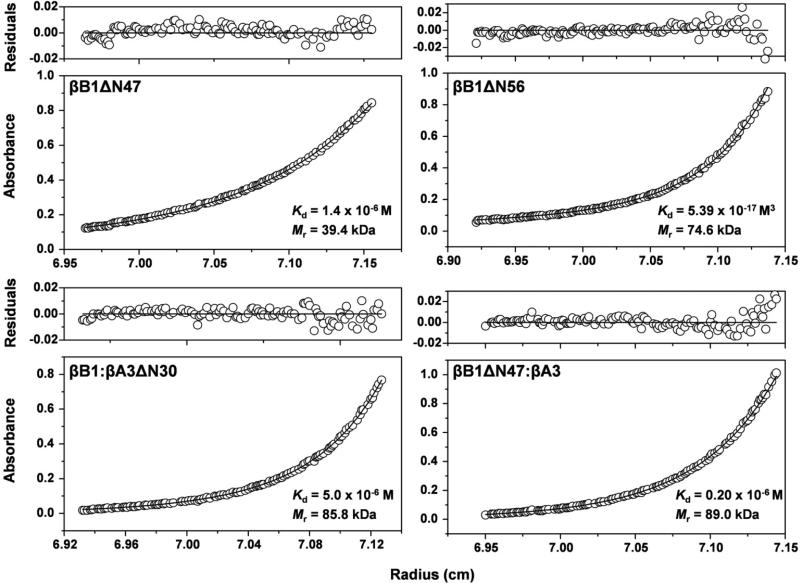
Figure 3. Sedimentation equilibrium of single and complexed β–crystallins.
The protein concentration profiles, absorbance (280 nm) vs radial distance, are indicated. The solid lines indicate the predicted monomer-dimer (βB1ΔN47) monomer-tetramer (βB1ΔN56) and heterodimer-heterotetramer (βB1ΔN47: βA3 and βB1: βA3ΔN30) systems. Open circles represent the experiment values. The upper panels of each graph show the residuals of the fitted curves to the data points.

