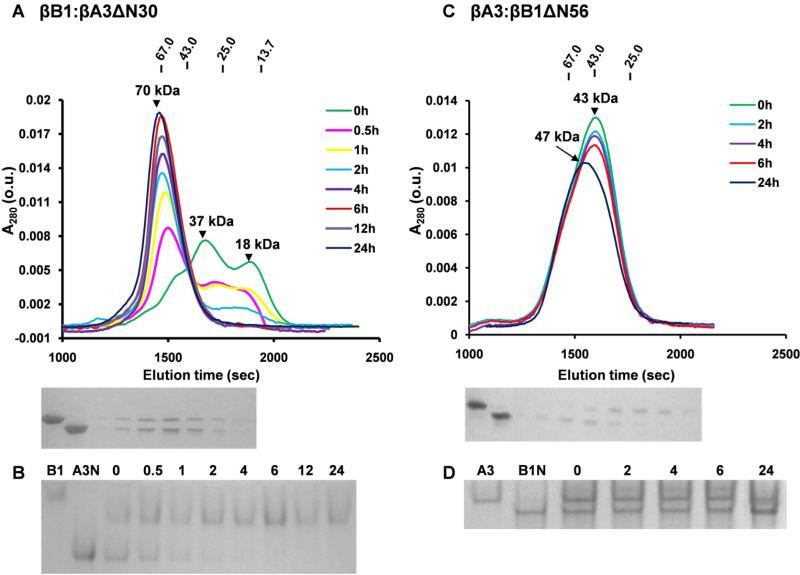
Figure 7. Size-exclusion chromatography and native gel electrophoresis of crystalline complexes.
(A) Chromatography of 10μM equimolar mixture of βB1 and βA3ΔN30 preincubated for indicated times (h). Molecular weights of major peaks were estimated as 18 kDa and 37 kDa at 0h and 70 kDa at > 4h. Molecular weights of standards are shown uppermost of Figure. SDS-PAGE of the fractions from the 24 h chromatogram is shown below the chromatograms where Lane 1 and 2 are βB1 and βA3ΔN30 standards. (B) Native gel electrophoresis of βB1 and βA3ΔN30 mixture incubated for indicated times (h) and where lanes 1 and 2 indicate βB1 and βA3ΔN30 (C) Chromatography of a 10μM equimolar mixture of βA3 and βB1ΔN56 with matching SDS-PAGE of the fractions from 24 h chromatogram, Lanes 1 and 2 are βA3 and βB1ΔN56. (D) Native gel electrophoresis of the βA3 and βB1ΔN56 mixture incubated for indicated times (h) where βA3 and βB1ΔN56 standards are indicated.

