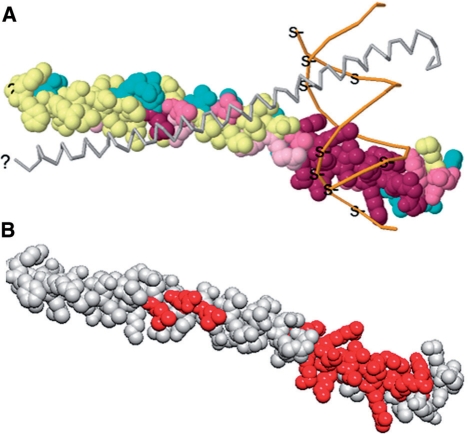
Figure 3.
Comparison of ConSurf and Evolutionary Trace analysis of C/EBPβ. (A) Image from ConSurf analysis of C/EBPβ homodimer (1GU4); chain A is shown using larger spheres and chain B backbone is shown; DNA (orange). Color progression from teal to maroon indicates increased conservation; yellow spheres indicate insufficient data. (B) Image from analysis of C/EBPβ homodimer (1GU4) with Evolutionary Trace. Red residues indicate conservation when plotted with the highest Z-score (7.146). Orientations are similar to those for the VENN analysis of the same protein in Figure 2.

