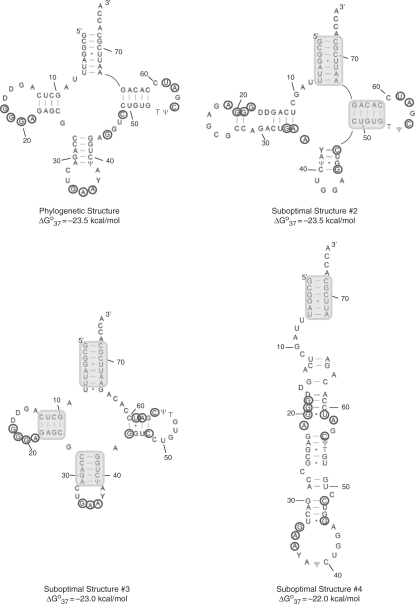
Figure 4.
Phylogenetic secondary structure and three predicted suboptimal structures of yeast tRNAPhe. The lowest free energy structure has 95% of the base pairs predicted correctly. Base paired regions that are predicted correctly in the suboptimal structures are shaded. Nucleotides cleaved by RNase H after 1 or 2 h incubation are circled. D denotes dihydrouracil while Y denotes wybutosine.

