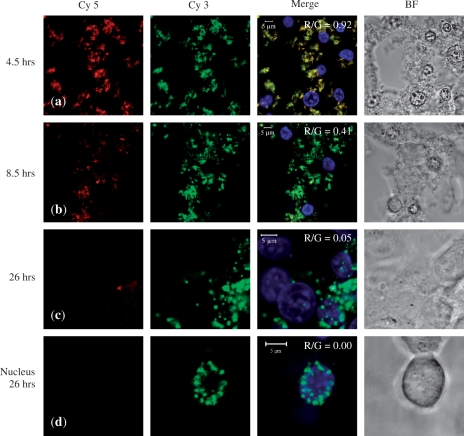
Figure 8.
FRET study. Confocal images taken of live MCEC at row (a) 4.5 h, row (b) 8.5 h and row (c) 26 h after initial exposure to peptide F/DNA complexes at N/P 20. The DNA had been double-labelled with both Cy5 and Cy3. During imaging, only Cy3 was excited. If there was FRET, Cy5 (false-coloured red) can also be detected, which will then co-localize with Cy3 (green) to give yellow signals in the merged image. Row (d) A nucleus at 26 h showing large scale accumulation of uncondensed DNA. All cells were stained for their nuclei with Hoechst (blue) and presented with the bright field (BF) images.

