Figure 1.
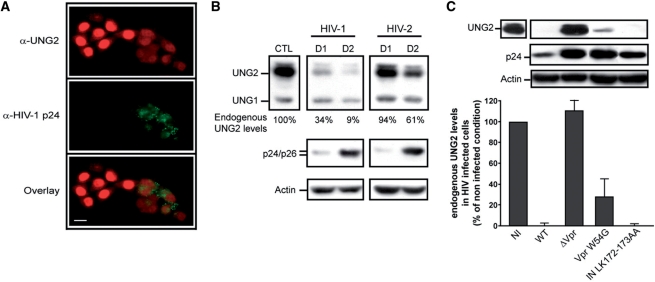
Endogenous UNG2 expression profile in HIV-infected cells. (A) Immunofluorescence of 5 × 10⁴ MAGIC-5B cells infected with HIV-1NLAD8 (100 ng/ml of Gag p24) for 48 h. After fixation and permeabilization, cells are labeled for HIV-1 p24 antigen (Green) and mitochondrial UNG1 and nuclear UNG2 (Red). Scale bar, 20 µm (B) Cell lysates of immortalized CEM T cells (2 × 10⁶) infected with HIV-1NL4.3 or HIV-2ROD (RT of viral input 4 × 10⁵ cpm) were analyzed by immunoblot using anti-UNG1/2 or anti-p24 or anti-actin mAbs, either 1 day (D1) or 2 days (D2) after infection. These data are representative of two experiments (C) Infection in triplicate of CEM T cells with wild type NL4.3 (WT), Vpr-deleted NL4.3 (ΔVpr), Vpr mutant NL4.3-VprW54G and Integrase mutant NL4.3-INLK172-173AA as in B. Forty-eight hours after infection, cells were analyzed for endogenous UNG2 expression by immunoblot (upper panel). Expression of p24 and actin are shown. In lower panel, densitometry scanning of immunoblots obtained with anti-UNG2 serum are expressed as the percentage of UNG2 expression observed in non-infected (NI) cells. Values are the mean of three separate experiments with standard deviations.

