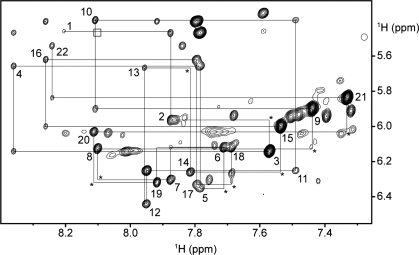
Figure 5.
NOESY spectrum (mixing time, 350 ms) showing the H8/H6-H1’ connectivity of 22CTA in K+ solution. Intraresidue H8/H6-H1’ NOE cross-peaks are labeled with residue numbers. Weak or missing sequential connectivities are marked with asterisks. The box indicates the position of a very weak cross-peak (not seen at this threshold) corresponding to the NOE from the H8 proton of G8 to the H5 proton of C5, consistent with a slipped alignment for the G8·C17·G20·C5 tetrad (see text).

