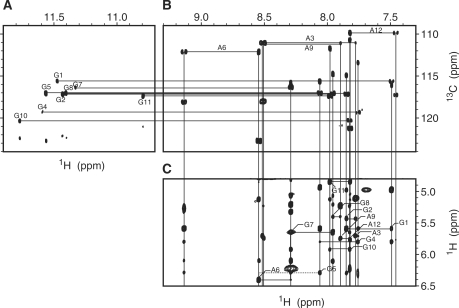
Figure 1.
NMR spectra for resonance assignments at 30°C. The imino (A) and base (B) regions of the JR-HMBC spectrum, being recorded with the 13C spectral width of 40 p.p.m. The H2-C4, H8-C4, H2-C6 and H8-C5 correlation peaks for each adenine, and the H8-C4 and H8-C5 ones for each guanine are connected by lines, respectively, in (B). The NH (imino proton)-C5 correlation peak in (A) and the H8-C5 in (B) for each guanine are connected by a horizontal line. (C) The fingerprint region of the NOESY spectrum with the mixing time of 150 ms. The H1′ (i-1)-H6/H8(i)-H1′ (i) connectivities are traced, intraresidue cross-peaks being denoted by residue numbers. Dots indicate cross-peaks that are observable when the contour level is lowered.

