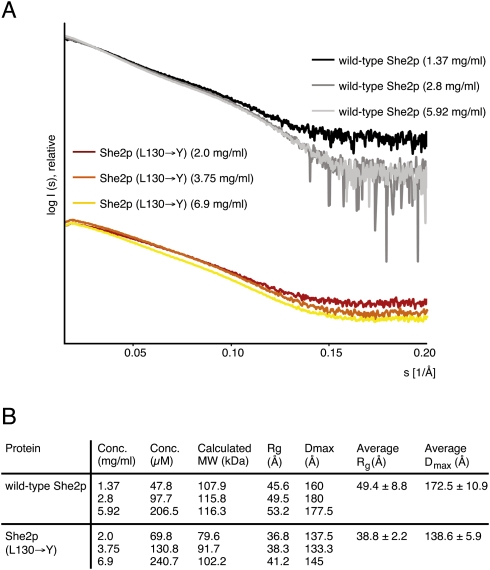
FIGURE 3.
Small-angle X-ray scattering studies with She2p. (A) Scattering curves obtained from wild-type She2p and She2p (L130→Y) at three different concentrations after buffer subtraction. The scattering intensity I is plotted logarithmically against the scattering angle s. With increasing scattering angles (s > 0.15/Å) the signal-to-noise ratio decreases. These data were excluded from calculation and are shown for completeness only. (Table in B) Summary of structural parameters determined from scattering curves.

