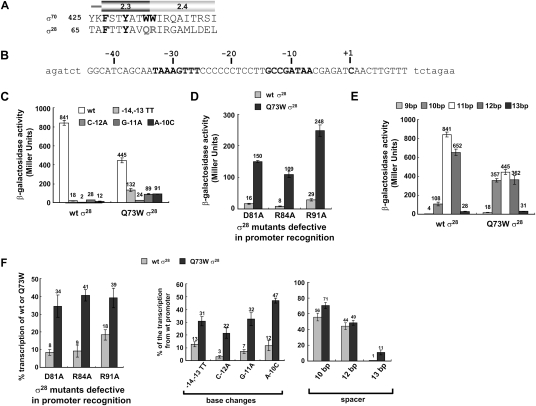
Figure 4.
Enhanced promoter utilization by Q73W σ28 in vivo and in vitro. (A) Amino acid sequence alignment of Regions 2.3 and 2.4 of E. coli σ70 and σ28. Bold letters are residues implicated in promoter melting in σ70, and the residues not conserved in σ28 are in gray. The numbers indicate amino acid sequence position. (B) Sequence of σ28-dependent promoter (Ptar) used in this study. Only the wild-type sequence of the tar promoter is shown; promoter variants were constructed from this sequence (Koo et al. 2009b). The native sequence of the tar promoter region is shown in capital letters, vector sequence is in lowercase, and −35 and −10 regions and transcription start site are shown in bold. (C) Expression from tar promoter mutants by RNAP containing wild-type or Q73W σ28 in vivo. β-Galactosidase activities (Miller units) of promoter∷lacZ fusions are shown. Assays were performed in CAG57115 (ΔfliA, ΔflgM) with plasmids expressing σ28 variants and bearing tar promoter variants∷lacZ. All values are averages of three independent experiments. (D) In vivo effects of the Q73W substitution on mutations in σ28 that eliminate promoter recognition determinants. β-Galactosidase activities (Miller units) driven by each σ28 variant on tested promoters are shown. All values are averages of three independent experiments. (Gray bar) Activity of each mutation in wild-type background; (black bar) activity of each mutation in Q73W background. (E) Expression from tar promoter mutants with nonoptimal spacers by RNAP containing wild-type or Q73W σ28 in vivo. β-Galactosidase activities (Miller units) are shown. All values are averages of three independent experiments. The spacer length was varied from 9 to 13 base pairs (bp); the wild-type tar promoter has an 11-bp spacer. (F) Effects of the Q73W substitution on mutations in σ28 that eliminate promoter recognition determinants and of tar promoter variants in vitro. Relative transcription determined from single-round run-off transcription assays (Supplemental Fig. S1) is depicted as bar graphs. Each experiment was repeated a minimum of three times, and numbers above each bar indicate average values of relative transcription. (Left graph) Effect of Q73W substitution on mutations eliminating promoter recognition determinants in σ28. Percent transcription was calculated as (intensity of transcript for RNAP with wild-type or Q73W σ28 carrying the specified additional substitutions in σ28)/(intensity of transcript for RNAP with wild-type or Q73W σ28). (Middle and right graphs) Expression from tar promoters with base substitutions (middle) and nonoptimal spacer lengths (right) by RNAP containing wild-type or Q73W σ28, normalized as described in Figure 3D.

