Figure 1.
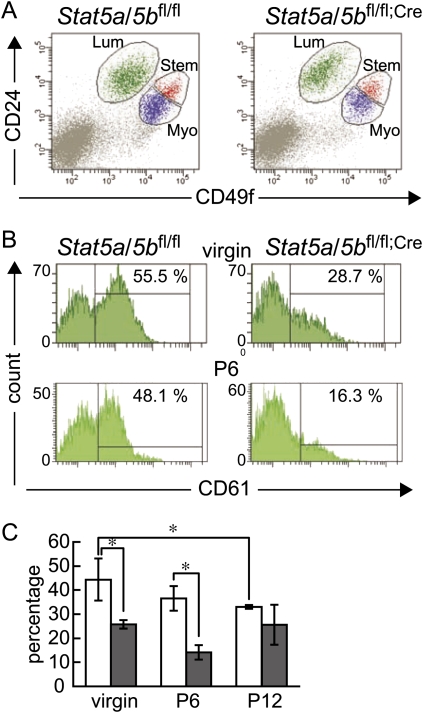
Flow cytometry analyses of mammary cells from Stat5a/5bfl/fl mice (left panels) and Stat5a/5bfl/fl;Cre mice (right panels). (A) Dot plot pattern of luminal (Lum; CD24hiCD49flo), myoepithelial (Myo; CD24loCD49fhi) and stem cell-enriched (Stem; CD24midCD49fhi) populations in 12-wk-old virgin mice. (B) CD61 staining histograms of luminal cell population (CD24hiCD49flo) in the mammary gland of 12-wk-old virgin mice (top panels) and 6 d pregnant mice (P6, bottom panels). The CD61+ population was determined according to fluorescence minus one (FMO) control of the same mouse. (C) Bar graph depicting the percentage of CD61+ cells in luminal cell populations of Stat5a/5bfl/fl (blank bars) and Stat5a/5bfl/fl;Cre (filled bars) mammary glands in virgins, and on day 6 (P6) and day 12 (P12) of pregnancy. Values are means ± SD. (*) P < 0.05.

