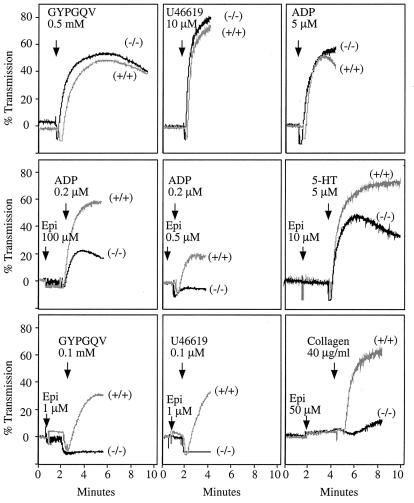
Figure 2.
Platelet aggregation in Gzα(−/−) mice. Platelets in plasma were stimulated with each of the agonists indicated. The results with the Gzα(−/−) are indicated as (−/−). The results obtained with their wild-type littermates are indicated as (+/+). The tracings shown represent data from at least three experiments. Epi, epinephrine; U46619, a TxA2 analog; GYP, PAR4 peptide agonist GYPGQV; 5-HT, serotonin.

