
Fig. 1.
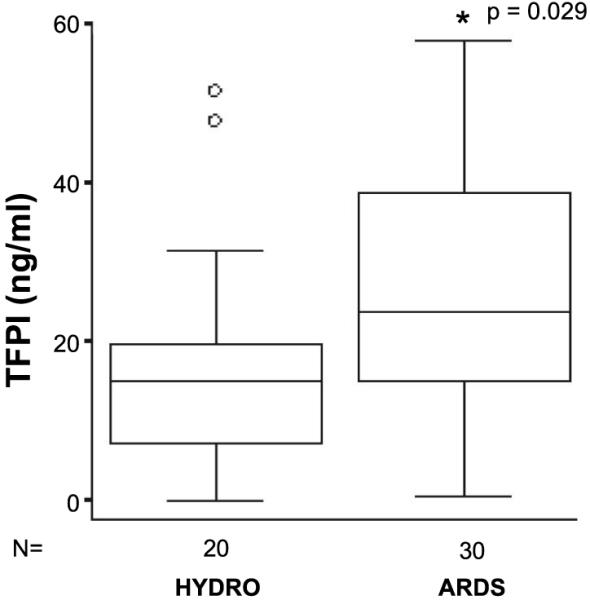
Boxplot of tissue factor pathway inhibitor (TFPI) protein levels in acute respiratory distress syndrome (ARDS) pulmonary edema fluid compared with hydrostatic edema fluid (HYDRO) as measured by ELISA. Horizontal line represents median value, box represents 25th-75th percentile, error bars represent 10th-90th percentile, open circles represent outliers. TFPI protein levels were significantly higher in ARDS vs. HYDRO (P = 0.029 by Mann-Whitney U test).