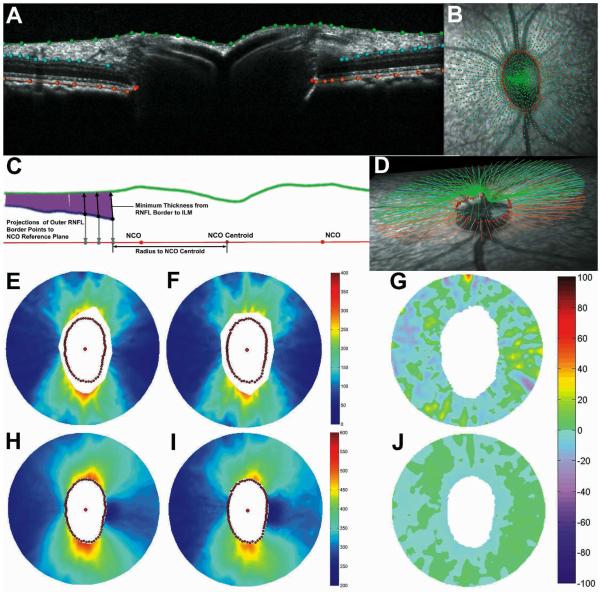
Figure 1.
Example of radial B-scan with results of manual segmentation (A, see text for details). Manual segmentation marks overlaid onto infrared fundus image (B). Schematic representation of method used to derive RNFL thickness values from segmentation results(C). Oblique view of full segmentation results for this eye (D). Topographic pseudo-color maps representing RNFL thickness (E and F) and total retinal thickness (H and I) after 30 min of IOP set to 10 mmHg (E and H), and after 60 min of IOP set to 45 mmHg (F and I). Topographic map representing % change of RNFL thickness (G) and total retinal thickness (J) between baseline and elevated IOP timepoints.

