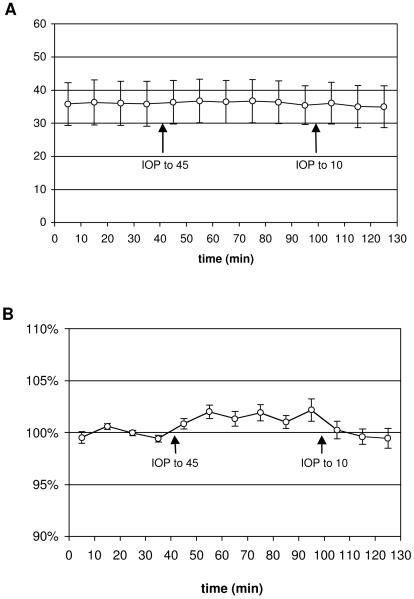
Figure 7.
Group average peripapillary RNFL retardance (± SD; n=8 eyes, 4 monkeys) versus time (A). Retardance values for each eye are normalized to their average baseline value and plotted (±SEM) versus time in the lower panel (B). Arrows indicate when IOP was elevated from baseline (IOP =10 mmHg) to IOP = 45 mmHg, and when IOP was lowered back to IOP = 10 mmHg.

