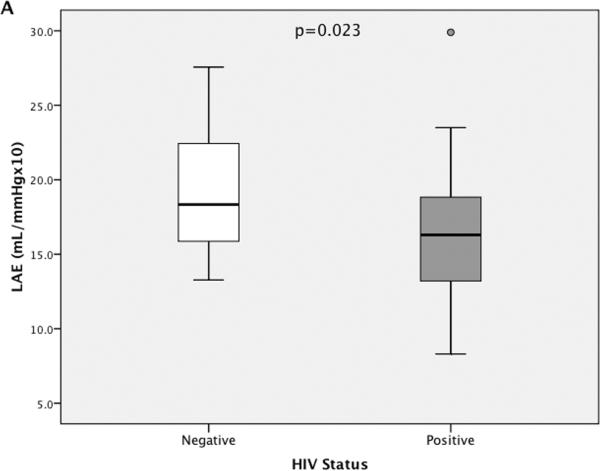
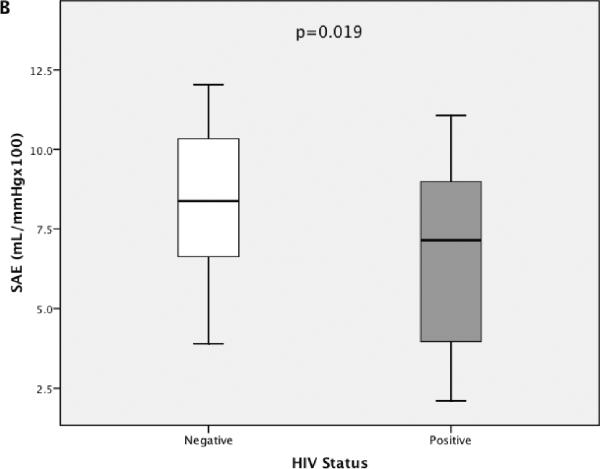
FIGURE 2.
The distribution of LAE (A) and SAE (B) estimates are presented, stratified by HIV status. Box plots represent the IQR with median values designated by a horizontal line. Error bars constitute minimum and maximum values. A, One high outlier (value >1.5 χ IQR higher than the third quartile) is designated for LAE within the HIV-infected group. P values represent a significantly lower mean LAE and SAE for HIV-infected participants compared with HIV-negative controls.


