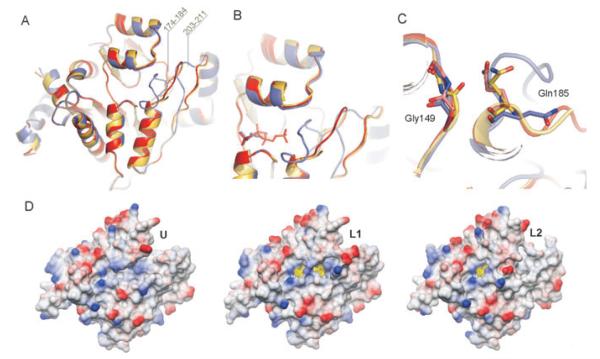
Fig. 5.
Ligand-induced conformational changes in the CggR effector-binding site.
A. Superimposition of C-CggR shown as a ribbon model in the unliganded U conformation (coloured yellow, with residues 180–182 missing in the model) and the two liganded conformations L1 (red) and L2 (blue). Regions that undergo large structural changes are indicated with their residue numbers.
B. Details of the CggR effector-binding sites with bound DHAP and FBP. Protein and ligands are coloured as in A.
C. Details of the structural rearrangements of residues Gly149 and Gln185.
D. C-CggR solvent-accessible surfaces in the U, L1 and L2 conformations. The surfaces are coloured according to electrostatic potential (blue positive, red negative, calculated with DS ViewerPro 6.0, Accelerys Software Inc.). The ligand molecule is represented as a stick model, and its solvent accessible surface is shown in transparent yellow.

