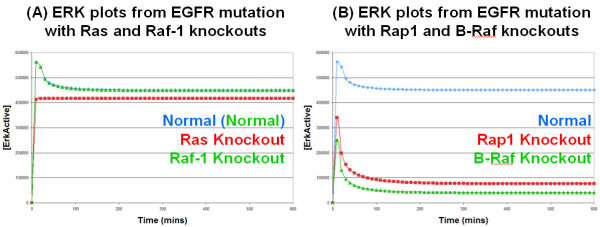
Figure 6.
Simulation results from EGFR mutation model: All the lines in these graphs represent simulated active ERK levels over 600 minutes. (A) Ras and Raf-1 Knockouts: The blue line represents active ERK levels with an EGFR mutation, whereas, the red and green lines represent active ERK levels with an EGFR mutation but also with a Ras or Raf-1 knockout, respectively; the green line is practically identical to the blue line and hence obscures the blue line from view. (B) Rap1 and B-Raf Knockouts: The blue line is the same as in (A), whereas, the red and green lines represent active ERK levels with an EGFR mutation but also with a Rap1 or B-Raf knockout, respectively.

