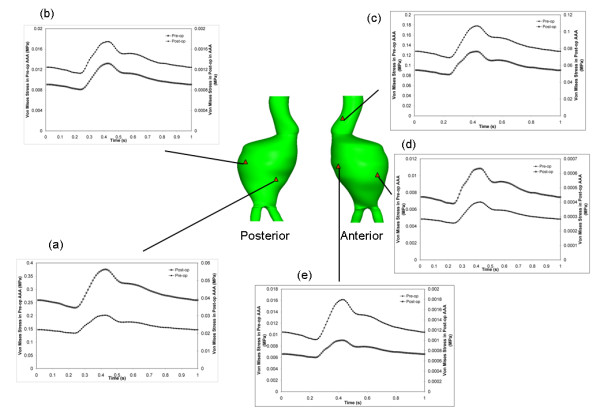
Figure 6.

Temporal von Mises stress distribution at 5 locations of interest on the aneurysm. Temporal stress change in Pre-op and Post-op models at the (a) pre-op peak stress location, (b) maximum diameter on the posterior surface, (c) aneurysm neck, (d) post-op minimum stress location and (e) maximum diameter on the anterior surface. The left y-axis indicates pre-op stress and the right y-axis indicates post-op stress.
