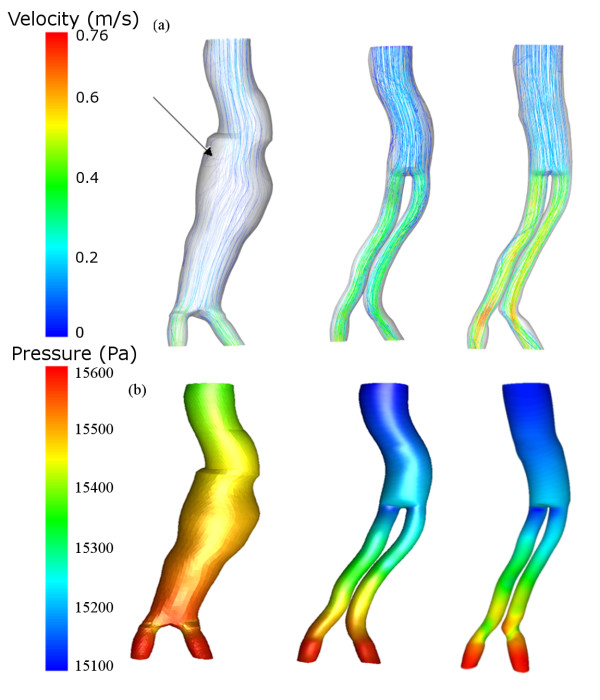
Figure 8.
Velocity pathlines and pressure. (a) Velocity pathlines (m/s) for the Pre-op (left), Post-op (centre) and Follow-up (right) cases and (b) pressure contours (Pa) for the Pre-op (left), Post-op (centre) and Follow-up (right) cases. These results are taken at the time of peak pressure (t = 0.4). The arrow indicates the presence of a vortex.

