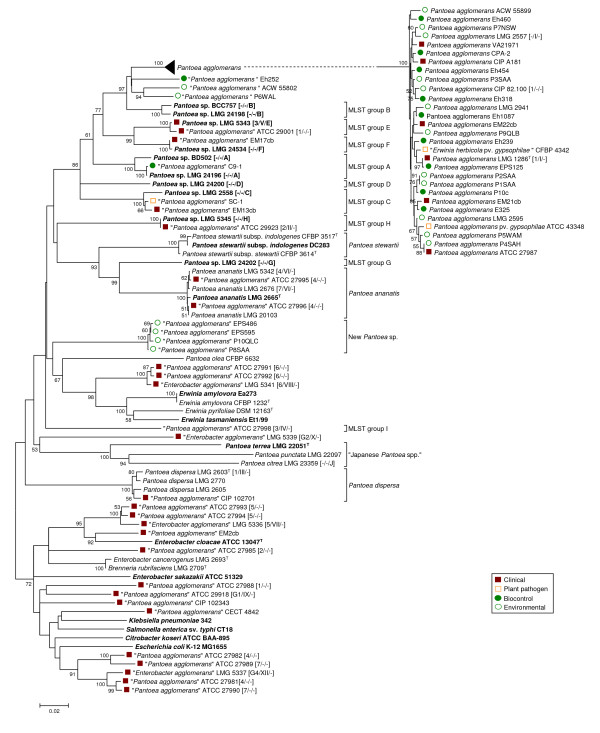
Figure 2.
Taxonomy of clinical and biocontrol isolates received as P. agglomerans, E. agglomerans or Pantoea spp. based on gyrB gene sequences. The trees were constructed with the Minimum Evolution method using a 747-bp fragment of the gene (725 positions, gaps completely removed from the analysis). Nodal supports were assessed by 1000-bootstrap replicates. Only bootstrap values greater than 50% are shown. The scale bar represents the number of base substitutions per site. Reference strains are marked in bold (T = type strain), for strains retrieved in a culture collection the classification in biogroups [50] and biotypes [41] and MLST-groups [40] is indicated between brackets.

