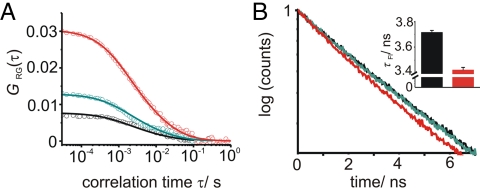
Fig. 2.
FCCS and fluorescence lifetime analysis of a fusion reaction. (A) Open circles: FCCS curves at 30 s (black), 3 min (green), and 60 min (red) of a fusion reaction of liposomes containing a stabilized acceptor complex of SNAP-25A, syntaxin 1A and synaptobrevin 2. Solid lines: corresponding theoretical fitting curves according to equation S4. (B) Corresponding normalized fluorescence decay curves of the donor dye. Inset of (B) Average values for nine 10-s measurements of the fluorescence lifetime at 0 min (black) and 60 min (red) fusion time are shown. Error bars correspond to the standard deviations.

