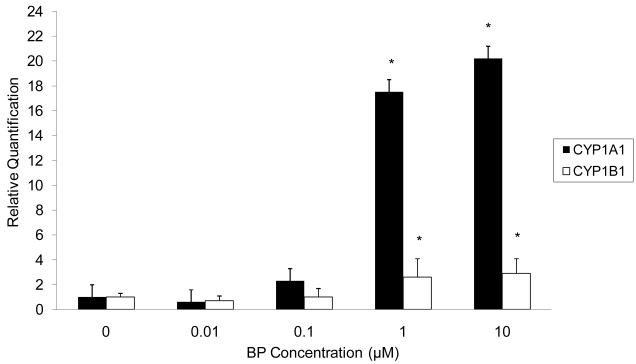
Figure 3.
CYP1A1 and CYP1B1 mRNA expression in UM-SCC-14A in response to different doses of BP. The cells were exposed to .01, .1, 1, or 10 μM BP for 48h. Vehicle-treated cells served as a negative control. Total RNA was isolated and reverse transcribed to generate cDNA. Real-time qPCR was performed to analyze the expression of CYP1A1 and CYP1B1 mRNA. Each sample was run in triplicate and mean values were used in subsequent calculations. The relative quantification (RQ) was determined by the 2 -Δ ΔCt method using normalization to β-actin and comparison to the vehicle-treated control. * indicates that target expression is significantly greater in BP-treated than vehicle-treated cells (p < 0.05).

